Saturday, July 5, 2014

Correlation matrix

The Correlation Matrix is a table that contains correlation coefficients among several markets (including precious metals) in different timeframes. This correlation matrix describes statistics and correlation matrix for study variables.

Source:http://www.emeraldinsight.com/journals.htm?articleid=1515237

Similarity matrix

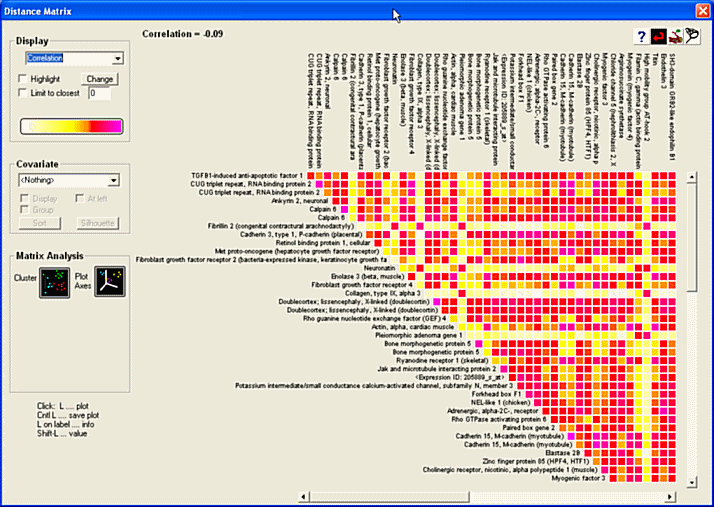
A similarity matrix is a matrix of scores that represent the similarity between a number of data points. Each element of the similarity matrix contains a measure of similarity between two of the data points. This matrix shows how window displays a matrix using the currently selected color spectrum to show the correlation between each member of the list or active subset with every other member.


Source:http://www.epicentersoftware.com/genetrix/support/WebHelp/Visualization/Similarity_Matrices_and_MDS/Using_Similarity_Matrices.htm

Stem and leaf plot


A stem-and-leaf plot is an organization of numerical data into categories based on place value. This plot shows high temperatures in Oswego.


Source:http://www.studyzone.org/mtestprep/math8/e/stemandleaf6l.cfm

Box plot

A boxplot is a convenient way of graphically depicting groups of numerical data through their quartiles. This box plot shows the daily mean temperature in degrees Fahrenheit (F) for November 1940, Madison, Wisconsin.
Source:http://weatherstories.ssec.wisc.edu/stories/armistice_day/climate.html

Histogram

A histogram is a graphical representation of the distribution of data. This Histogram is shown in paraview. The Histogram filter extracts a histogram from field data.
Source:http://daac.hpc.mil/software/ParaView/ParaView_Histogram.html

Parallel coordinate graph

A parallel coordinate plot maps each row in the data table as a line, or profile. This graph shows High Linear Correlation in Parallel Coordinates – Example (the fish data with 9 variables): The parallel coordinates plot shows that the three fish length variables (L1, L2, L3) are very highly correlated. This finding implies that L2 and L3 contribute very little additional information from L1.


Source:http://www.evl.uic.edu/aej/424/kyoung/Training-parallelcoordinate.html

Triangular plot

A triangular plot is a mixture of 3 variables being plotted. In this graph the allocations between aleutian sources are being plotted.


Source:http://www.pmel.noaa.gov/maillists/tmap/ferret_users/fu_2007/msg00384.html